Painless R Learning? Generate QQ Plots and Linear Regression with One Sentence
When many people first encounter R, they often ask: “I already know Excel—why should I learn R?” For simple tabular statistics, Excel is usually sufficient. But once you move into data analysis, BI, research, or business modeling, you quickly run into problems that Excel either cannot handle at all or handles very poorly, while R can solve them with just a few lines of code. Unfortunately, R also comes with a steep learning curve, unfamiliar syntax, and high practical barriers to adoption.
That situation is changing. With the SheetAI data analysis tool, users no longer need to learn R itself. By simply describing their analytical goals in natural language, the system can automatically perform modeling, visualization, and result interpretation.
Below are two classic examples—both of which are difficult to standardize in Excel: QQ Plots and Linear Regression.
Sample Data (Price-Related Data)
| distance | weight | price |
|---|---|---|
| 100 | 1.2 | 320 |
| 150 | 1.5 | 420 |
| 200 | 2.0 | 510 |
| 250 | 2.3 | 620 |
| 300 | 2.8 | 760 |
| 350 | 3.0 | 820 |
| 400 | 3.5 | 950 |
| 450 | 3.8 | 1020 |
| 500 | 4.2 | 1150 |
| 550 | 4.5 | 1230 |
1. Creating a QQ Plot: Just One Sentence
Create a QQ plot based on the price data
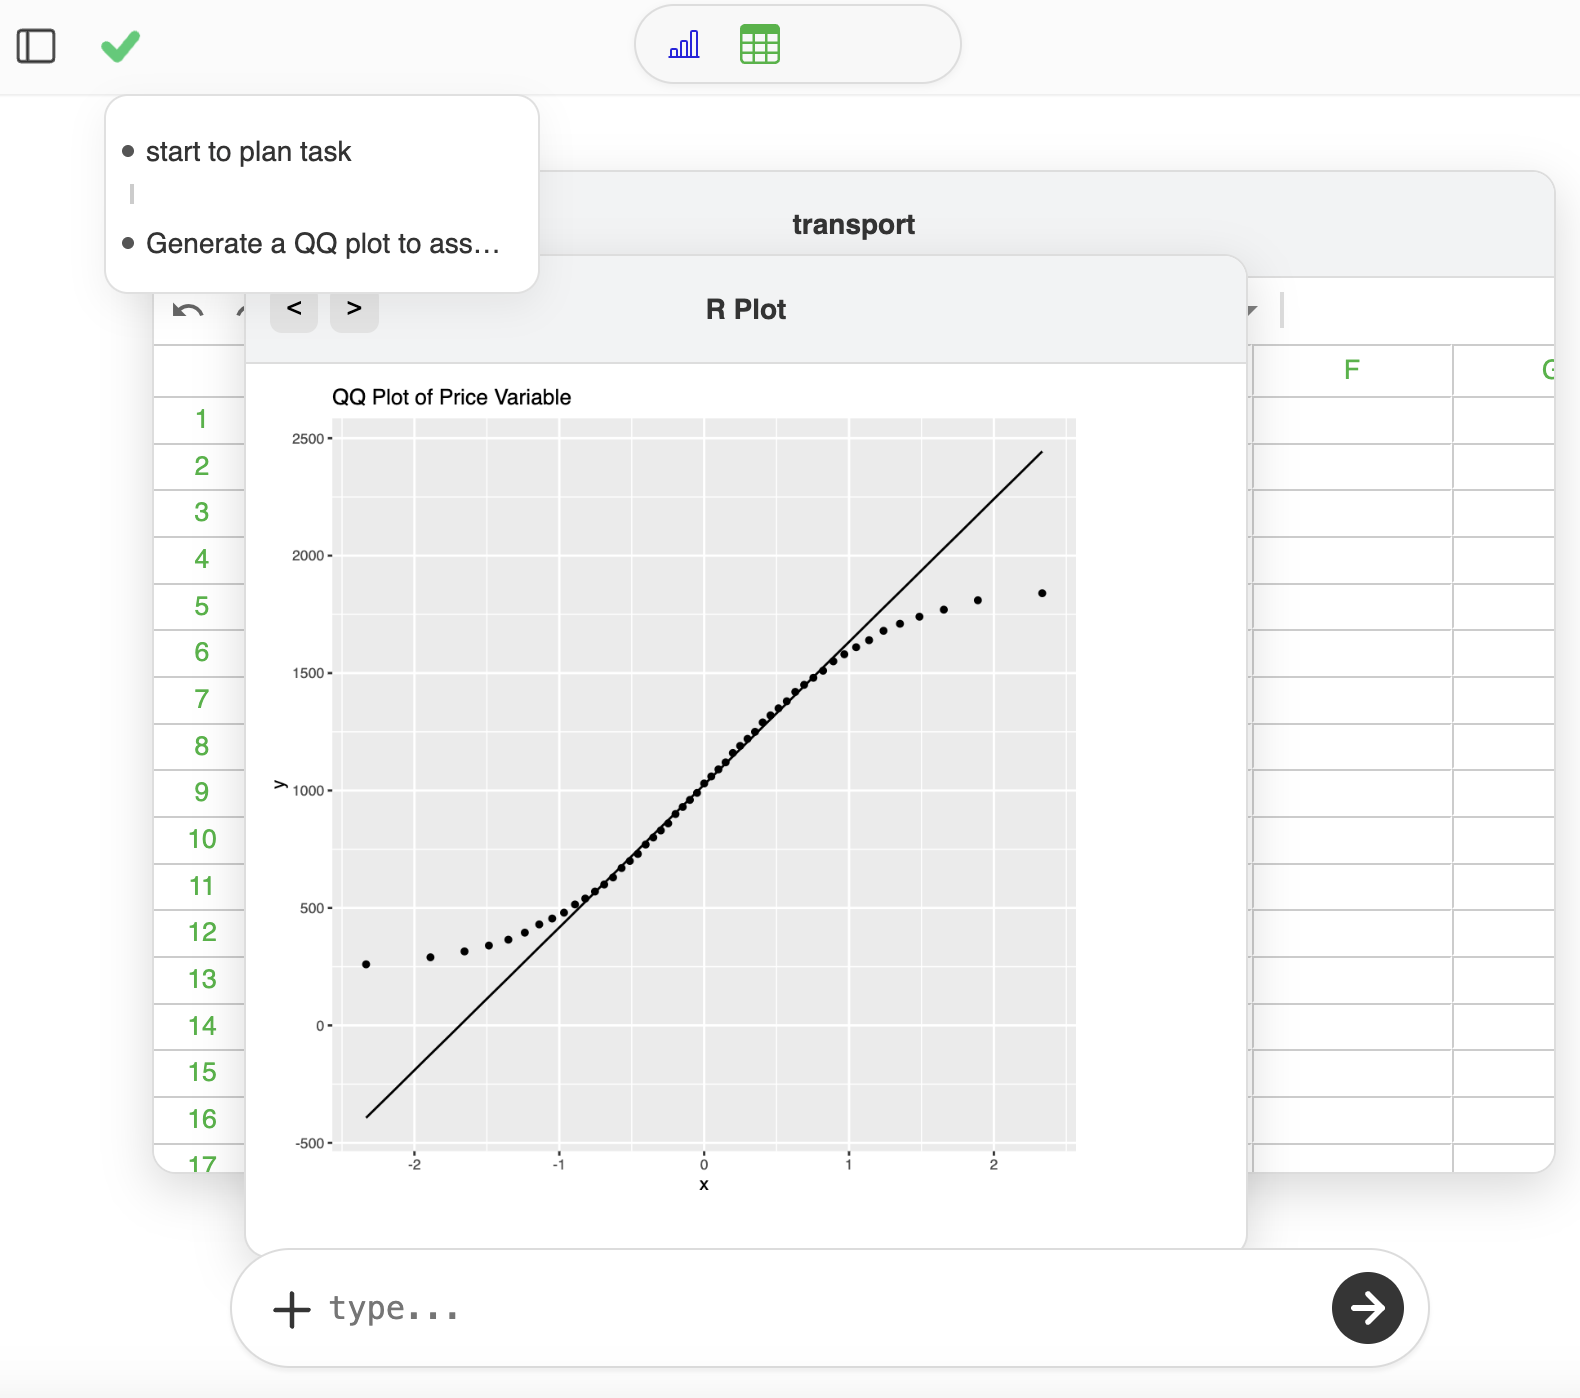
Result interpretation: The points align closely with the reference line in the middle region, but deviate on both tails. This suggests that the price data is approximately normally distributed overall, with mild tail deviations that may indicate extreme values or heavier tails.
This kind of distribution diagnosis is a standard prerequisite for statistical modeling, yet it is extremely difficult to perform consistently in Excel. With AI-driven R analysis, both the plot and the interpretation are generated automatically.
2. Building a Linear Regression Model: From Data to Insight in One Sentence
Build a linear regression model based on the existing data
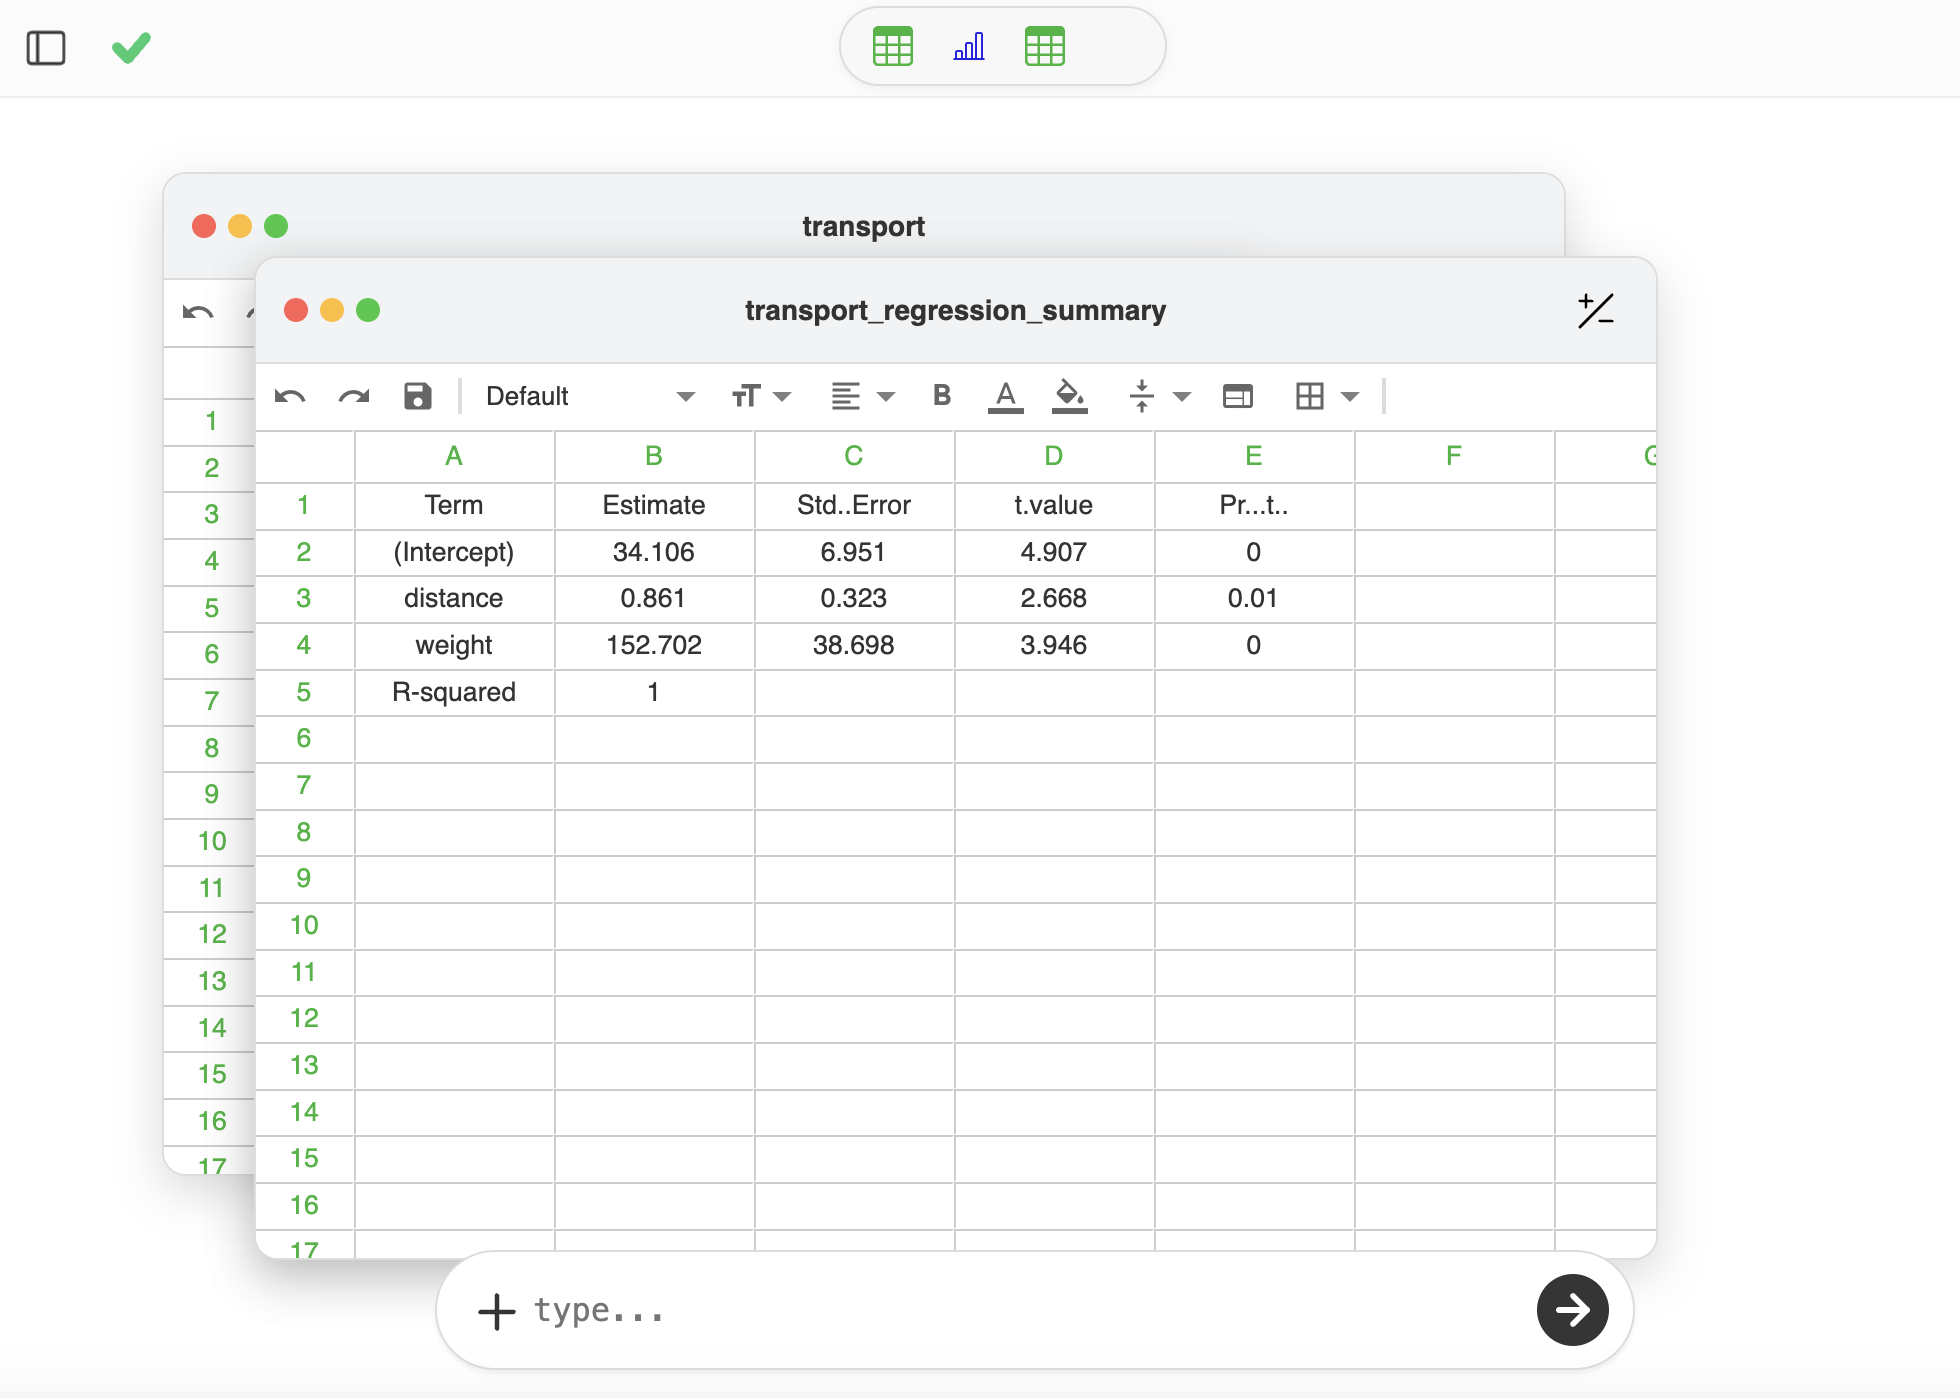
Model Output
| Term | Estimate | Std. Error | t value | Pr(>|t|) |
|---|---|---|---|---|
| Intercept | 34.106 | 6.951 | 4.907 | 0.000 |
| distance | 0.861 | 0.323 | 2.668 | 0.010 |
| weight | 152.702 | 38.698 | 3.946 | 0.000 |
Result interpretation: Both distance and weight have statistically significant positive effects on price. Holding other variables constant, longer distances and heavier loads are associated with higher transportation costs, and weight shows a particularly strong impact.
How SheetAI Are Changing the Workflow
In the past, R was a barrier; today, R has become an engine. Users only need to focus on the question: Is the distribution reasonable? Which factors drive the outcome?
SheetAI automatically plans analytical steps, selects appropriate statistical methods, generates charts and interpretable results, and turns what once required a strong statistics background into something anyone can complete with a single sentence.