How to Transpose Rows and Columns
If you work with Excel long enough, you will eventually face this problem: the data is correct, but the orientation is wrong. Rows should be columns, columns should be rows.
This usually happens with monthly data, metrics tables, or reports exported from other systems. Excel can do it — but the process is rarely smooth.
A Very Common Example
Imagine you receive a table like this every month:
| Metric | January | February | March | April | May | June | July | August | September | October | November | December |
|---|---|---|---|---|---|---|---|---|---|---|---|---|
| Revenue | 12000 | 13500 | 14200 | 15000 | 15800 | 16200 | 17000 | 16800 | 15500 | 16000 | 16500 | 18000 |
| Orders | 320 | 355 | 380 | 410 | 430 | 450 | 480 | 470 | 440 | 460 | 475 | 520 |
| Profit | 2800 | 3100 | 3400 | 3600 | 3900 | 4100 | 4500 | 4400 | 4000 | 4200 | 4300 | 4800 |
But for analysis or charting, you actually need this structure: one row per month, metrics as columns.
How SheetAI Handles This Differently
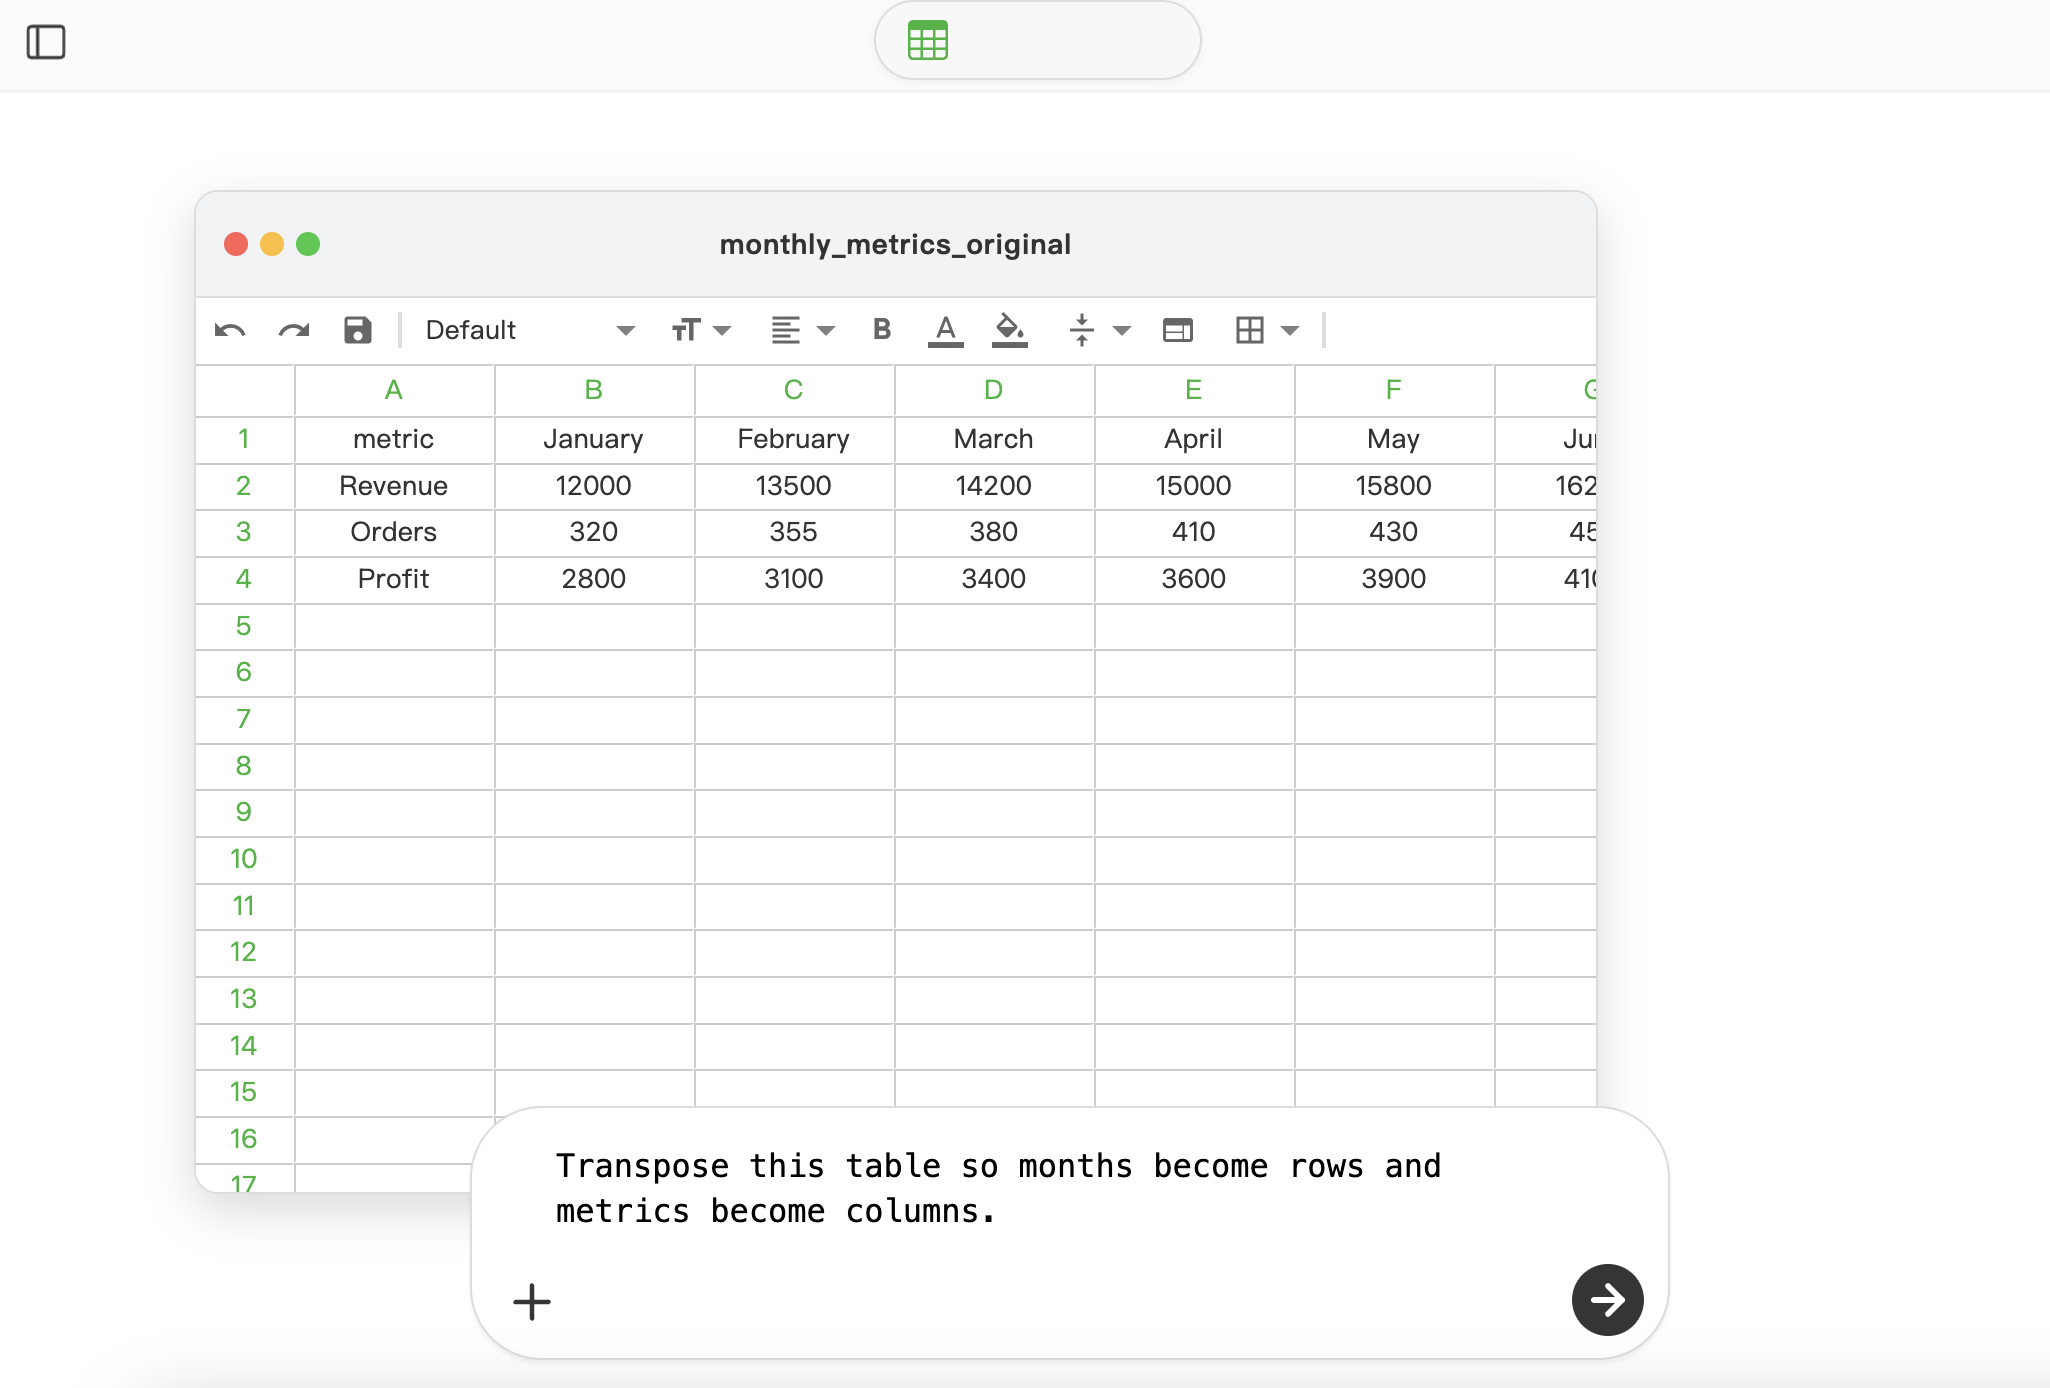
In SheetAI, you don’t perform the steps yourself. You describe the intent.
For example: “Transpose this table so months become rows and metrics become columns.”
It figures out how to restructure the data and produces the result directly.
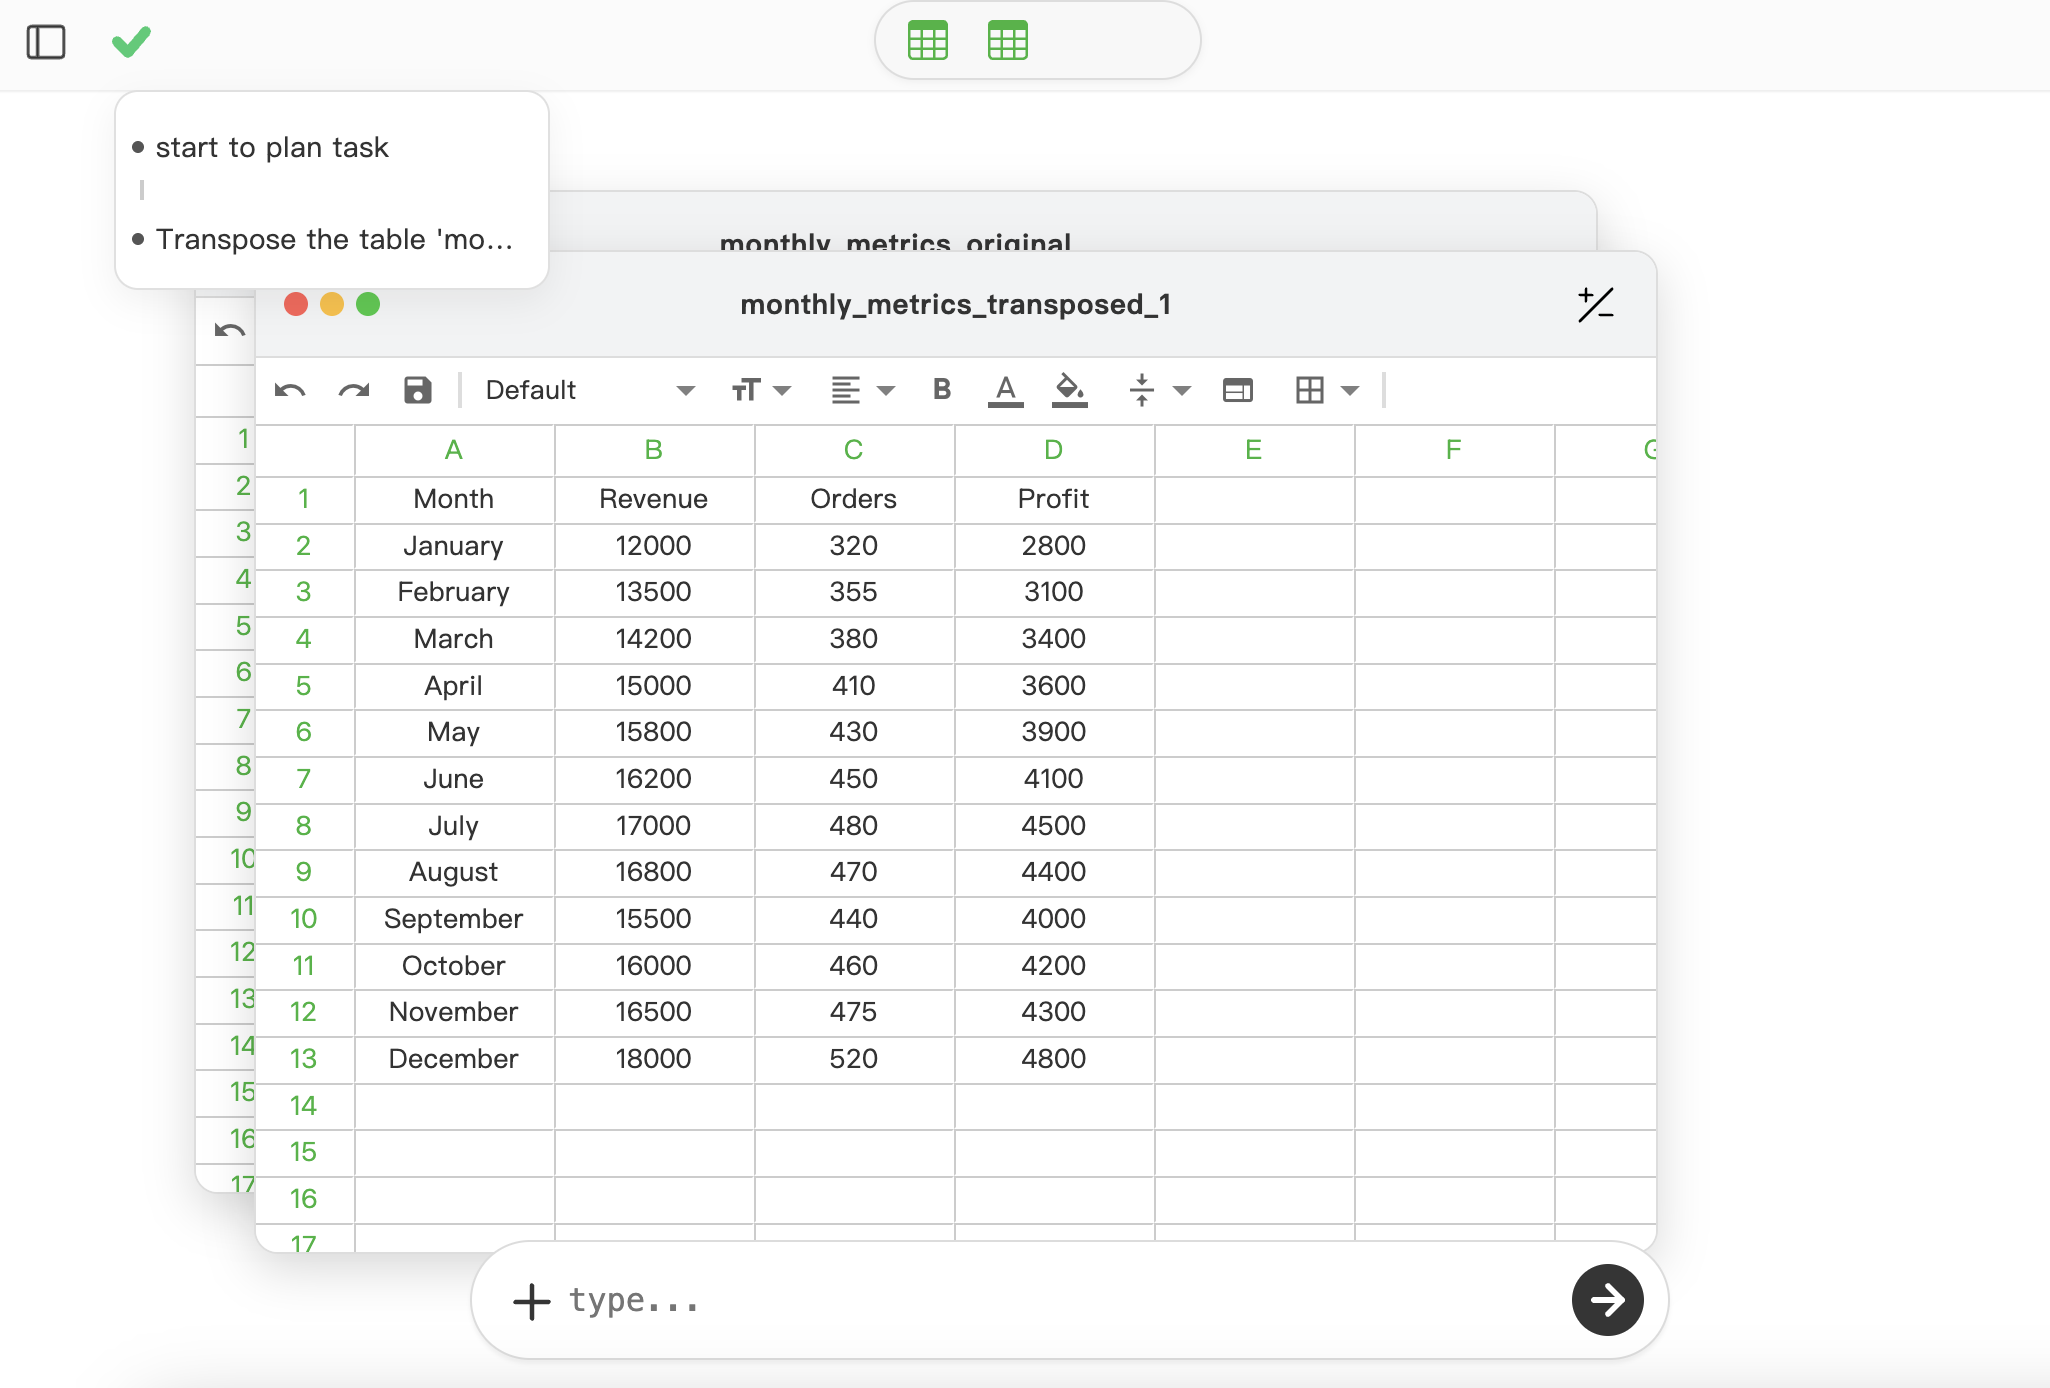
If you want to see how automatic re-runs and live data refresh work, you can read the reference documentation here:
Live Data Refresh & Reusable Workflows – SheetAI Documentation
Sometimes productivity is not about doing bigger things faster, but about removing dozens of small interruptions from your workflow.