How to Summarize Sales Data by City and Product (Excel Scenario)
This is a typical Excel scenario. Start with a flat sales table and need to summarize it across two dimensions.
One dimension is city, the other is product. Sometimes you want total sales amount, sometimes total units sold, and sometimes both.
In Excel, this usually involves creating pivot tables, adjusting fields, and formatting. Beginners might even have to manually build a table and paste the summary results.
Sample Raw Sales Data (Excel Format)
The starting point is a raw sales table where each row represents sales for a specific city and product.
| City | Product | Sales Amount | Units Sold |
|---|---|---|---|
| Osaka City | Smartphone | 125000 | 50 |
| Osaka City | Wireless Earbuds | 42000 | 70 |
| Sakai | Tablet | 47000 | 21 |
| Higashiosaka | Laptop | 82000 | 11 |
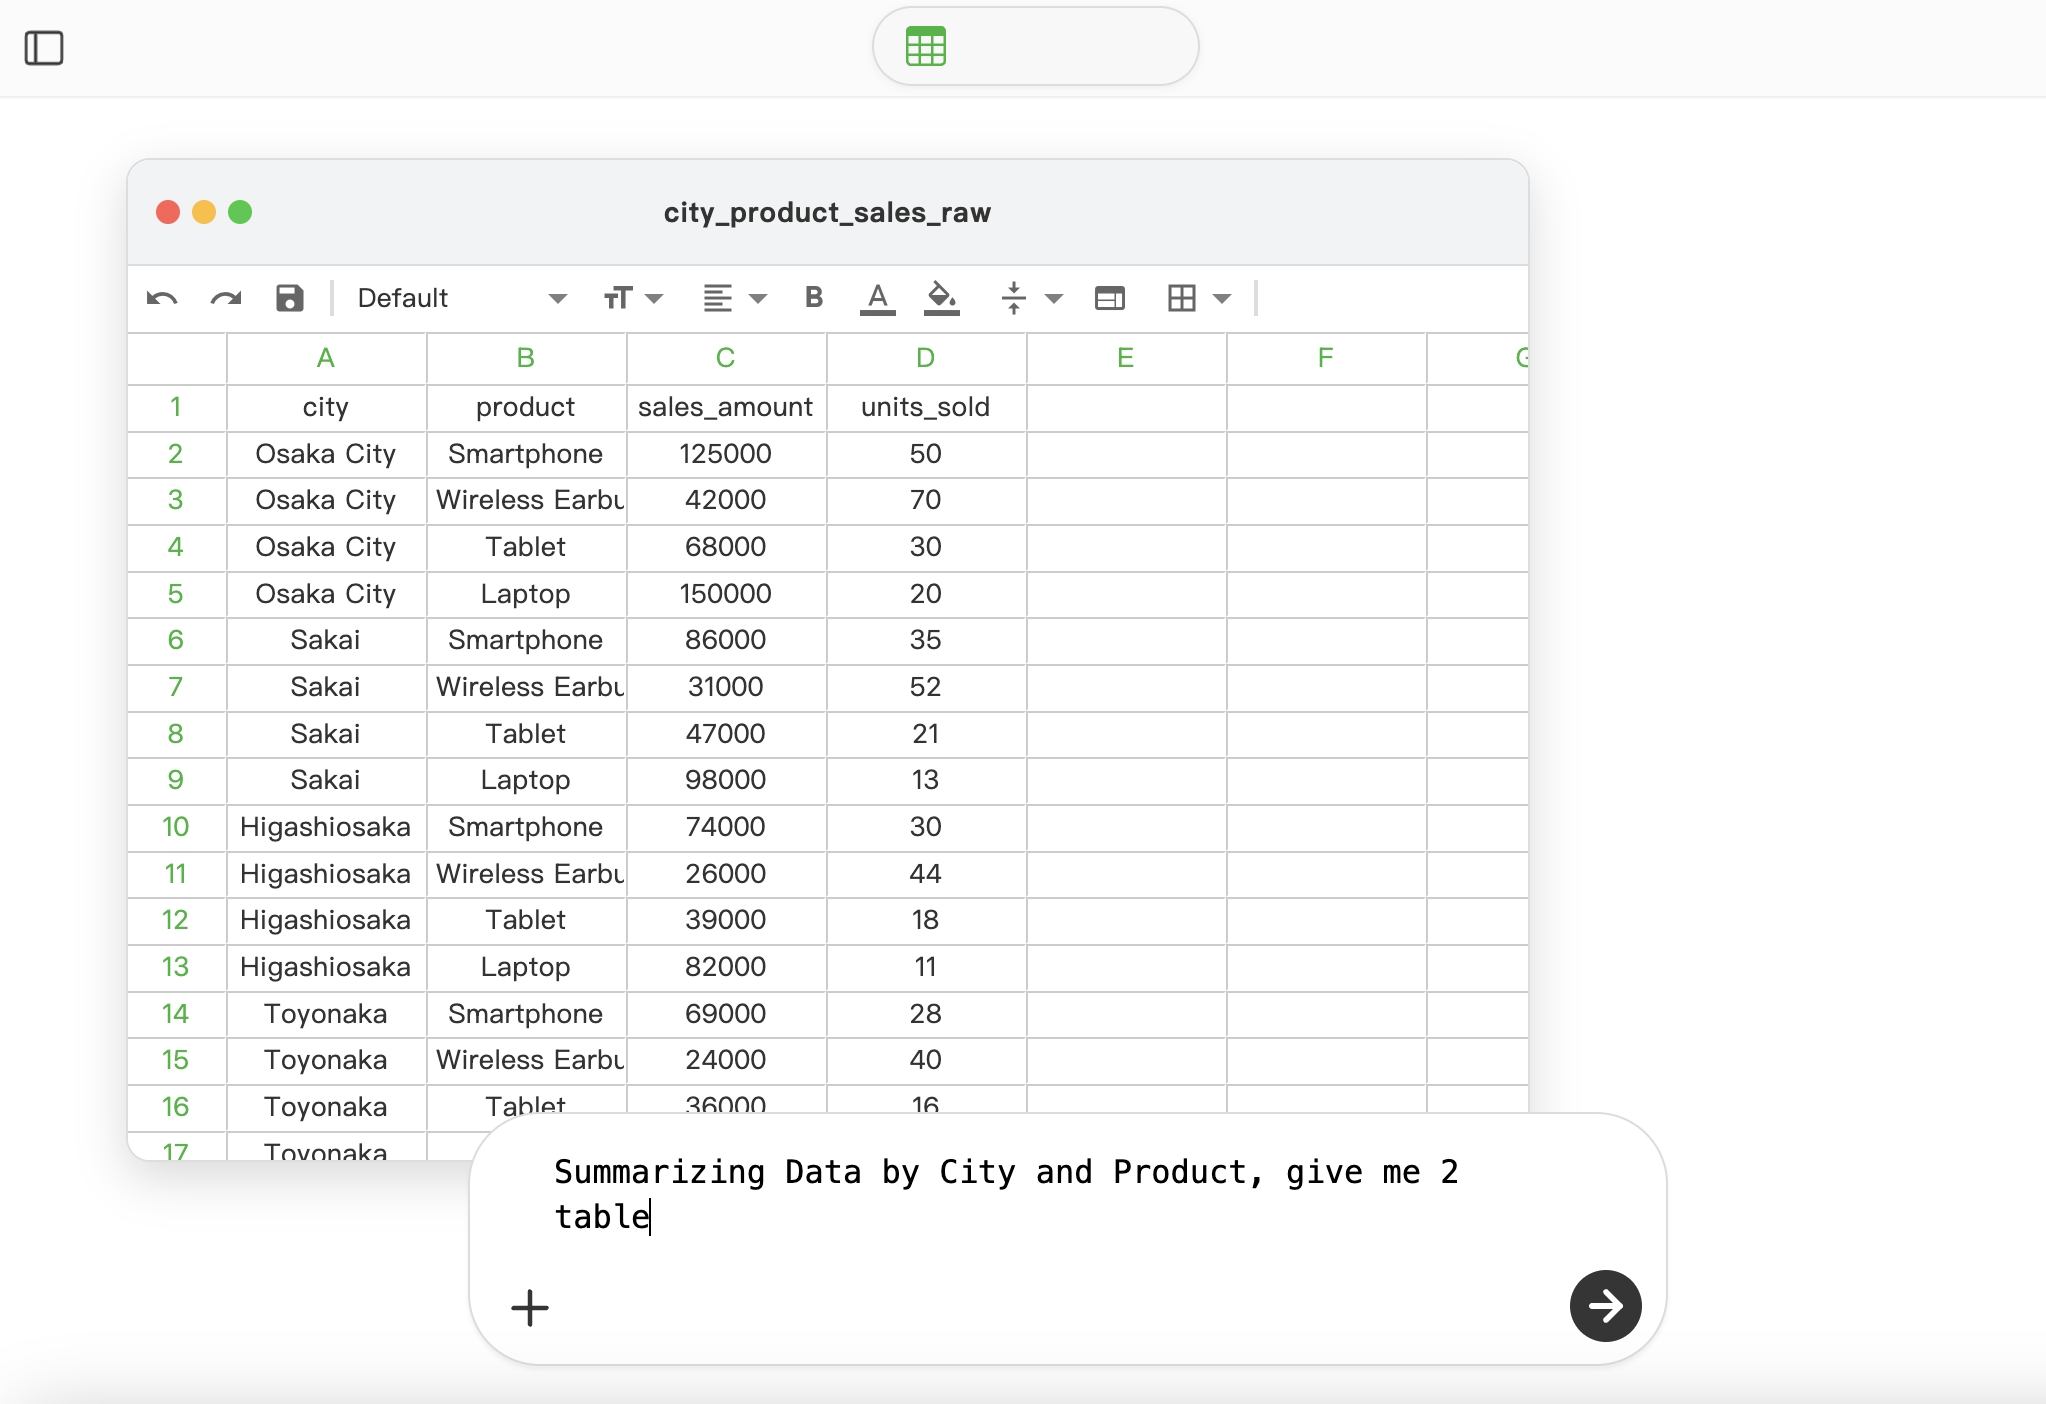
This type of data structure is very common in sales, operations, and regional performance analysis, and it is where repetitive tasks often occur.
Instruction Example: Generate Summary by City and Product
Instead of manually building pivot tables, just provide one instruction:
“Summarize data by city and product, generate two tables”
Example of Generated Summary Tables
After executing the instruction, two result tables are generated:
The first table summarizes total sales amount and units sold by city.
The second table summarizes total sales amount and units sold by product.
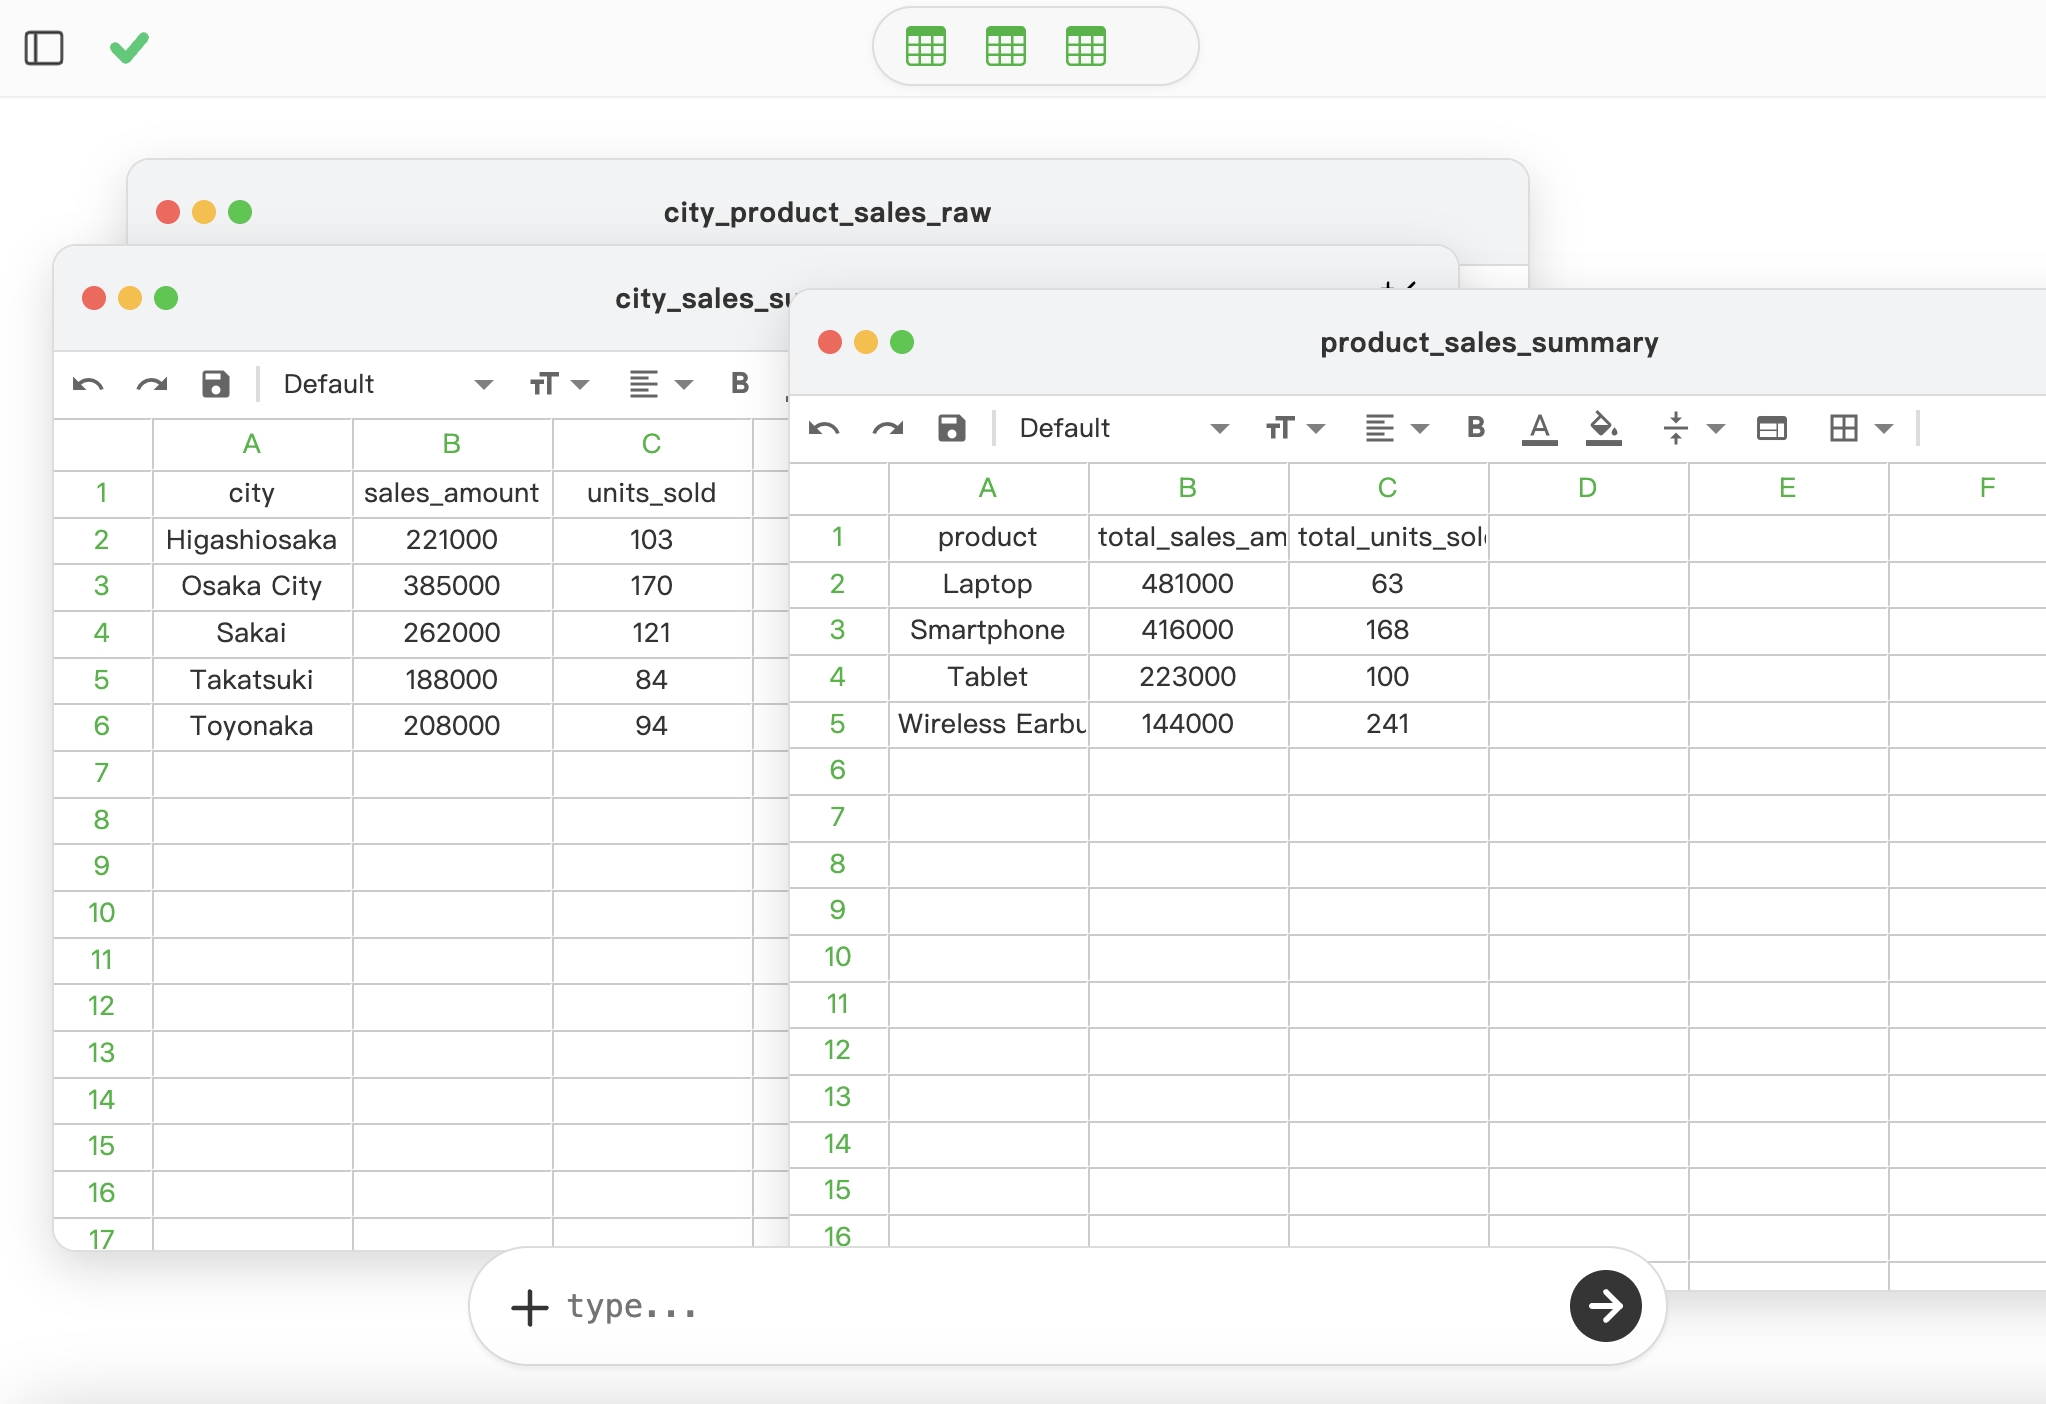
Both tables are clean, structured, and ready for reporting or visualization.
Summary Analysis Process
SheetAI analyzes the structure of the original table, identifies grouping dimensions, and determines the appropriate aggregation method.
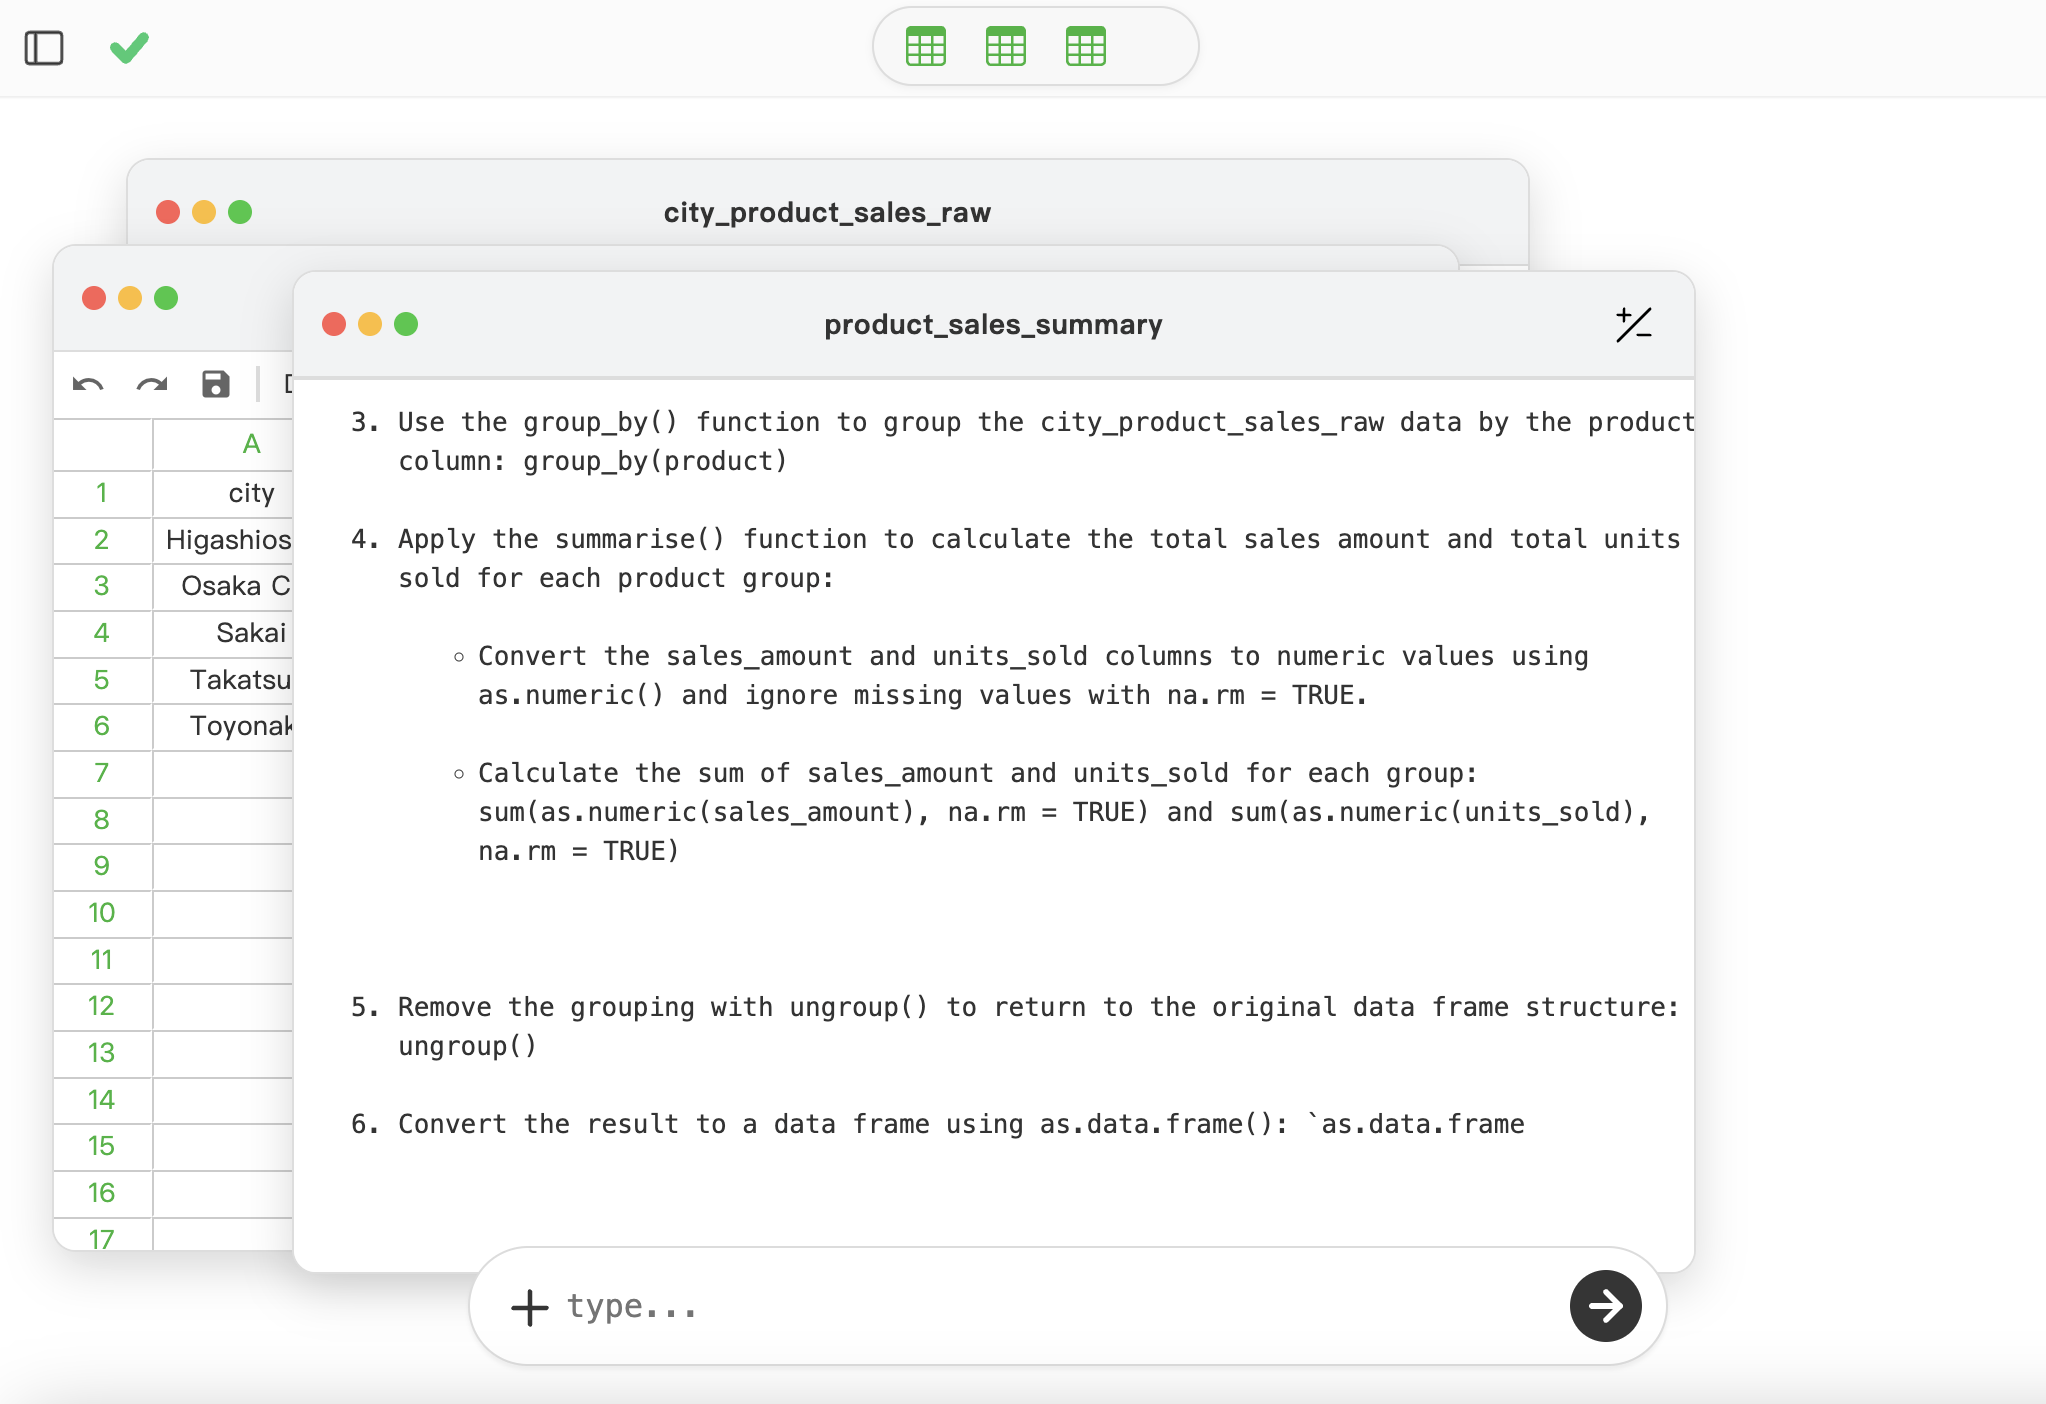
The image above shows the entire generation process. Each step can be verified; it is not a black-box operation.
Moreover, this workflow can be reused. When the same type of sales data is uploaded again, the same summary results are produced consistently.
Multiple Excel steps can be simplified into a single summary operation, saving effort and allowing more focus on understanding what the numbers actually mean.