Case Study in Biomedical Data Analysis: Safety Risk Assessment Using SheetAI
SheetAI in Action: Biological Data Analysis Case
In this case study, SheetAI demonstrates its ability to streamline complex biological data analysis. Initially, two separate datasets were provided, and the user requested: "Clean and organize the two datasets to ensure that each patient’s follow-up records are complete and properly aligned."
SheetAI automatically cleaned and merged the datasets, ensuring each patient’s follow-up data was consistent and ready for analysis.
Next, the user asked: "Visualize cholesterol changes for different patients across multiple time points." Using R, SheetAI generated detailed and professional visualizations for each patient, helping identify trends over time.
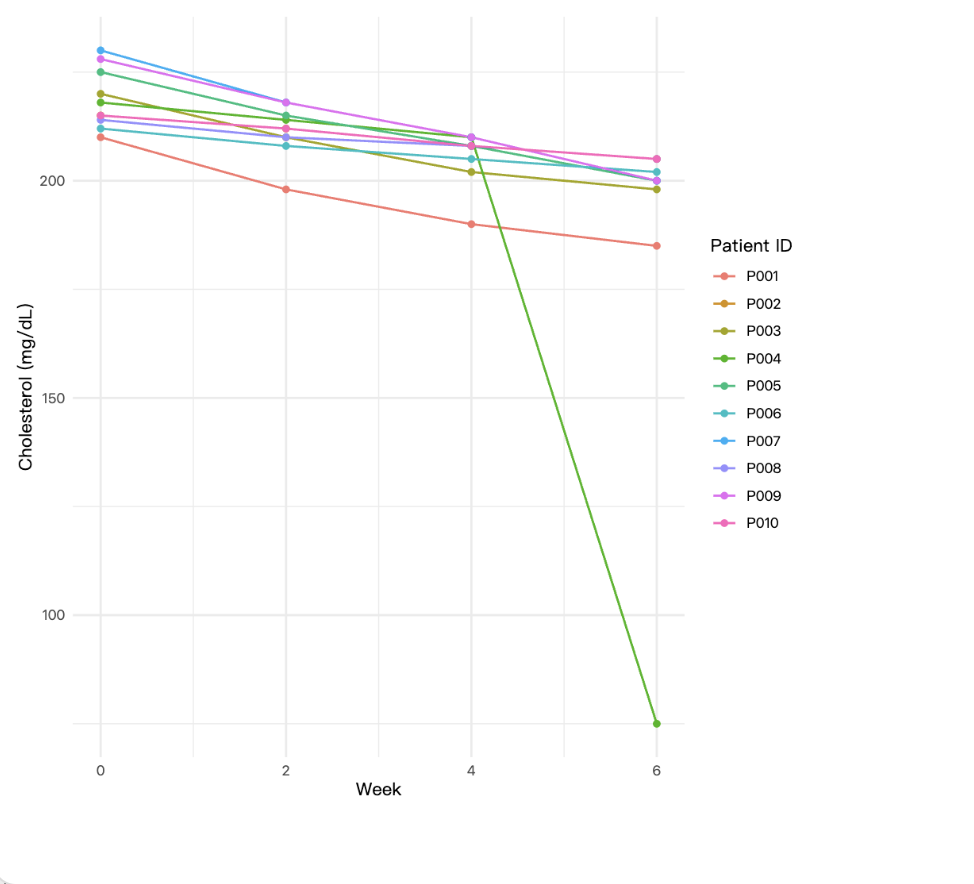
The user then requested: "Perform statistical tests such as t-tests or mixed-effects models to evaluate drug efficacy by comparing the treatment and control groups, report confidence intervals or p-values." SheetAI executed the analyses and produced comprehensive result tables, including mixed-effects model estimates and t-test comparisons.
Finally, the user asked: "Generate a concise report summarizing the drug’s effects, potential risks, and recommended next steps." SheetAI produced the following report:
Safety Risk Analysis Based on Cholesterol and Heart Rate Results
A comprehensive evaluation integrating mixed-effects modeling and t-tests showed no statistically significant or clinically concerning changes in cholesterol or heart rate for the treatment group. Confidence intervals included null effects, and p-values exceeded conventional thresholds.
Summary Table of Key Statistical Findings
| Indicator | Effect Type | Estimate / Mean Difference | 95% Confidence Interval | P-value | Interpretation |
|---|---|---|---|---|---|
| Cholesterol (mg/dL) | groupDrug (Mixed) | 1.68 | -18.70 to 22.06 | 0.872 | No significant change; no clinical concern |
| Cholesterol (mg/dL) | week:groupDrug (Mixed) | 1.34 | -4.11 to 6.79 | 0.632 | No temporal trend; clinically insignificant |
| Cholesterol (mg/dL) | Week 0 (T-test) | 7.8 | -1.98 to 17.58 | 0.094 | Non-significant trend; no definitive risk signal |
| Heart Rate (bpm) | groupDrug (Mixed) | 9.26 | -11.15 to 29.67 | 0.379 | Non-significant elevation; no clinical concern |
| Heart Rate (bpm) | week:groupDrug (Mixed) | -4.72 | -10.17 to 0.73 | 0.098 | Suggestive reduction; borderline significance |
| Heart Rate (bpm) | Week 0 (T-test) | 4.6 | -0.19 to 9.39 | 0.056 | Marginally non-significant; interpret cautiously |
This case highlights SheetAI's core capabilities: automatically importing datasets, generating statistical models, creating charts, and producing interpretive reports. Powered by AI, users can complete complex biomedical data analyses without writing code, greatly enhancing efficiency and reproducibility.
For the full interactive report, see: SheetAI Report